Count, proportion and density
One histogram can show counts, proportions or densities. When bins have different widths, use density so that each bar's area shows its share of the data.
For one bin with count c, total observations n and width w (W6 p. 11):
| Vertical axis | Formula | 40-50 bin: c=4, n=20, w=10 |
|---|---|---|
| Count | c | 4 |
| Proportion | c/n | 4/20 = 0.20 |
| Density | c/(n×w) | 4/(20×10) = 0.020 |
With equal widths the three versions have identical shapes; only the axis scale changes. Density matters when widths differ (W6 p. 13). Then bar area, height × width, must equal the proportion of observations in the bin, so heights must be densities.
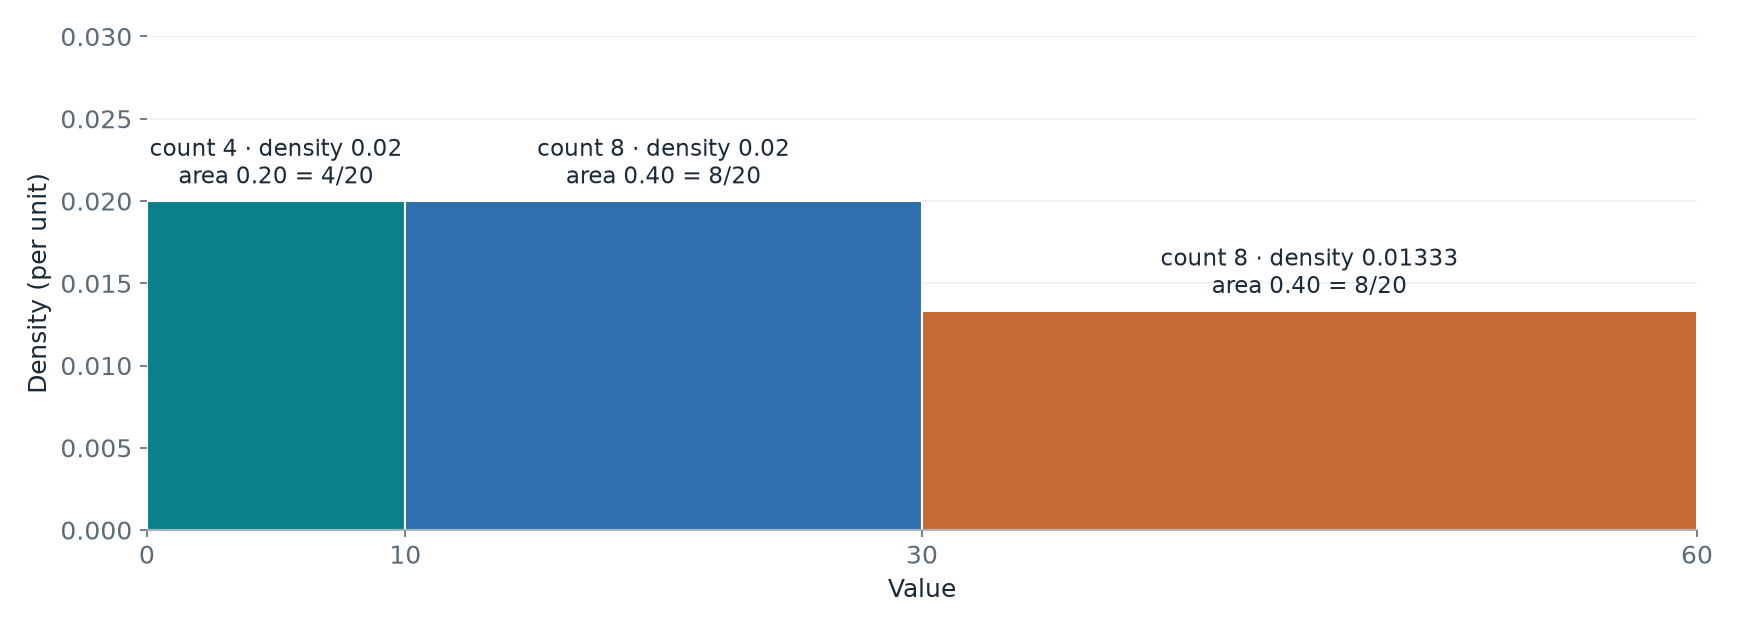
| Bin | Width | Count | Density | Area |
|---|---|---|---|---|
| 0-10 | 10 | 4 | 4/(20×10) = .020 | .20 |
| 10-30 | 20 | 8 | 8/(20×20) = .020 | .40 |
| 30-60 | 30 | 8 | 8/(20×30) = .0133 | .40 |
The first two bins have equal density but the wider one holds twice as many observations. The last bin holds as many observations as the second but is lower because they are spread over a wider interval. Areas add to 1. If counts were used as heights here, the 30-60 bar would get area 8×30, overstating that interval.
Exit question (W6 p. 33): a density bin with height 0.02 and width 10 contains 0.02×10 = 0.20 of the observations, i.e. 20%. In matplotlib, plt.hist(x, bins=edges, density=True) draws densities.
Source: W6 PDF pp. 1-37. Most numbers in the lecture are illustrative or constructed for teaching; pp. 26-27 reuse the Week 5 synthetic registration counts. The Week 6 lab manual (L6) practises Week 5 EDA reasoning and is worked through section by section in Lab work.
Practice problems
Supplementary study questions on the lecture concepts — not verbatim exam questions. Each answer counts toward spaced review.
1. Conceptual understanding
Definitions and distinctions.
A bin has count 4, n=20 and width 10. What is its density?
A density bin has height 0.02 and width 10. What fraction of observations lies in it?
2. Application
Apply the concept to a case or calculation.
A bin has 6 of 20 observations. What is its proportion?
With equal-width bins, how do count, proportion and density histograms differ?
3. Interpretation and limitations
Evaluate assumptions and justify conclusions.
Bin 30–60 holds 8 of 20 values. What is its density?
What do all bar areas in a density histogram sum to?
Explain it in writing
Self-checked, not marked. Write a few sentences, then compare with the example answer. Your writing is saved as you type.
Show an example answer
Area = 0.02 × 10 = 0.20, so 20% of the observations are in that bin.
Check: did you answer the question, use evidence or working, and avoid claiming more than the evidence supports?
Show an example answer
Both have density 0.020. The second bin is twice as wide, so its area, 0.40, is twice the first's 0.20, matching 8 versus 4 observations.
Check: did you answer the question, use evidence or working, and avoid claiming more than the evidence supports?