Baselines: bars start at zero, lines may focus
A bar shows a value by its length, so it must start at zero. A line shows change by position and slope, so a focused axis can be honest if its limits are clear.
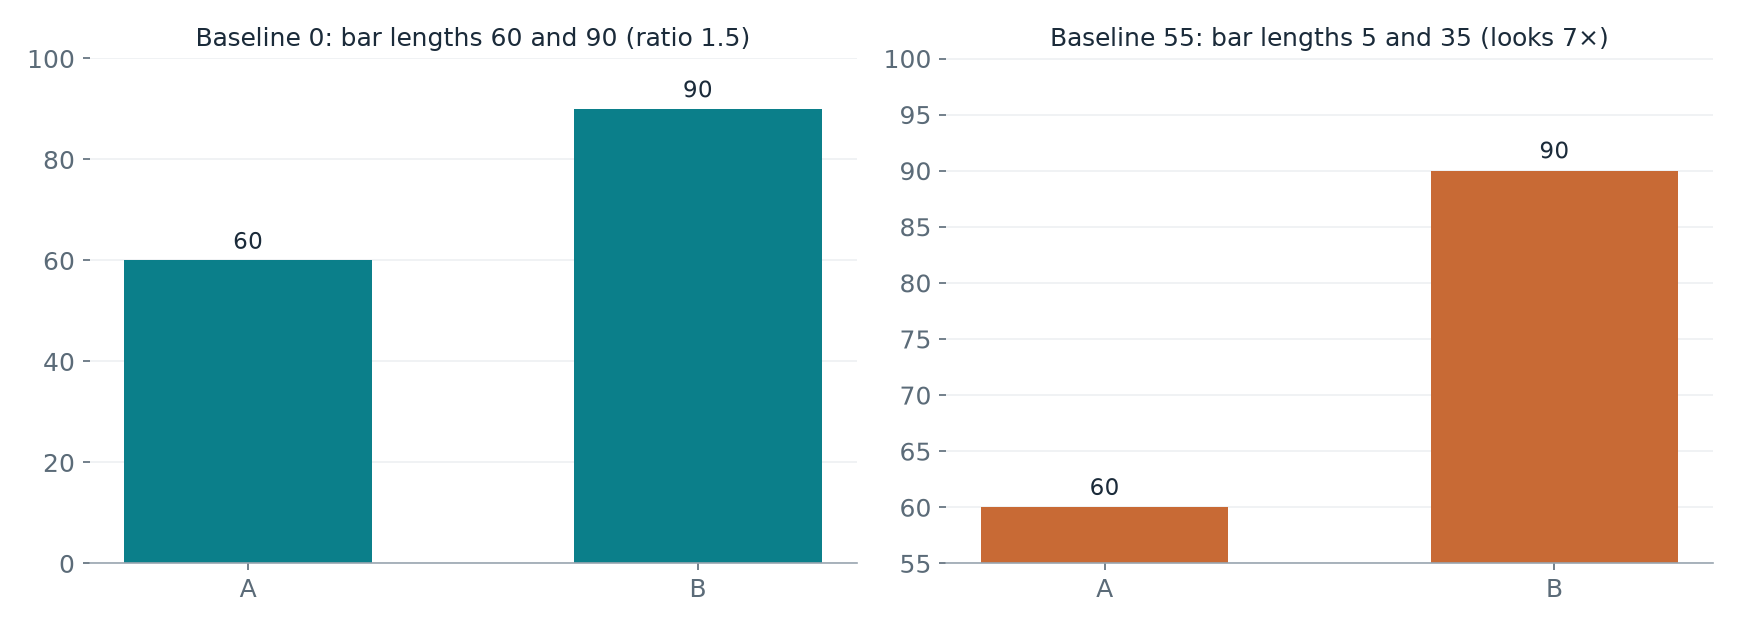
A bar encodes its value by length, so the length must be measured from zero. W6 p. 2 shows values 60 and 90. With a zero baseline the bars have lengths 60 and 90 and the visible ratio is the true ratio, 90/60=1.5: B is 50% higher than A. With the axis starting at 55 the visible lengths are 90-55=35 and 60-55=5, so B looks (90-55)/(60-55)=7 times as long.
Visible ratio with baseline b: (value₂-b)/(value₁-b). It equals the true ratio only when b=0.
A line chart is read by position and slope, not by length from zero. W6 p. 19 plots the same temperatures, 20°C rising to 21°C, on a 0-25°C axis and on a 19-22°C axis. Both show the same 1°C increase; the focused axis reveals detail and is legitimate when its limits are explicit and the wording stays proportionate ("rose by 1°C", not "soared"). If readers also need the size of the change relative to the whole level, show the context panel too.
Checklist rule (W6 p. 32): bars start at 0 on a clearly labelled common axis. For lines, state the axis range, and never let a focused axis carry a claim about relative size that the numbers do not support.
Source: W6 PDF pp. 1-37. Most numbers in the lecture are illustrative or constructed for teaching; pp. 26-27 reuse the Week 5 synthetic registration counts. The Week 6 lab manual (L6) practises Week 5 EDA reasoning and is worked through section by section in Lab work.
Practice problems
Supplementary study questions on the lecture concepts — not verbatim exam questions. Each answer counts toward spaced review.
1. Conceptual understanding
Definitions and distinctions.
Values 60 and 90 are drawn as bars starting at 55. How many times longer does the second bar look?
A line chart shows 20°C rising to 21°C on a 19–22°C axis. Is this acceptable?
2. Application
Apply the concept to a case or calculation.
Values 40 and 60 are drawn as bars from baseline 30. What is the visible ratio?
Values 60 and 90: how much higher is 90 than 60?
3. Interpretation and limitations
Evaluate assumptions and justify conclusions.
Why must bar charts start at zero?
When is a 0–25°C context panel worth adding to a focused 19–22°C line chart?
Explain it in writing
Self-checked, not marked. Write a few sentences, then compare with the example answer. Your writing is saved as you type.
Show an example answer
The bars have lengths 90−55=35 and 60−55=5, suggesting 35/5=7 times. The true ratio is 90/60=1.5, so 90 is 50% higher than 60.
Check: did you answer the question, use evidence or working, and avoid claiming more than the evidence supports?
Show an example answer
A line is read by position and slope, not by length from zero, so a focused range reveals the 1°C change honestly when its limits are labelled. A bar's length would misstate the values unless it starts at zero.
Check: did you answer the question, use evidence or working, and avoid claiming more than the evidence supports?